|
<< Click to Display Table of Contents >> Improving Simulation Speed |
  
|
|
<< Click to Display Table of Contents >> Improving Simulation Speed |
|
As the ASH WARE simulation technology has evolved, new features has resulted in some slowdown in simulation speed. Through understanding of the factors that affect simulation speed the information provided here can help you improve your simulation speed.
With the introduction of advanced features such as displaying variables in the waveform window and storing large amount of trace data, the simulator can now (sadly) get bogged down performing GUI updates. It is possible to eliminate this 'drag' on the simulation speed using the following command line options.
-NoEnvFile
-Minimize
-AutoRun
This causes the simulation windows to (mostly) remain closed, the trace data to NOT be stored in the trace buffer, and DevTool to be hidden from view thereby avoiding (potentially) slow display updates. This has the added benefit of 'hiding' DevTool such that you can continue to use your computer for other tasks.
Two following command line options can reduce the number of rebuilds.
-AutoBuild
-NoBuild
At the start of your regression test consider using the -AutoBuild option to force DevTool to initially build your code. On subsequent simulation runs pass the '-NoBuild' option to prevent additional rebuilds from occurring. Depending on the complexity of your code this could save up to seconds or even minutes on every simulation run.
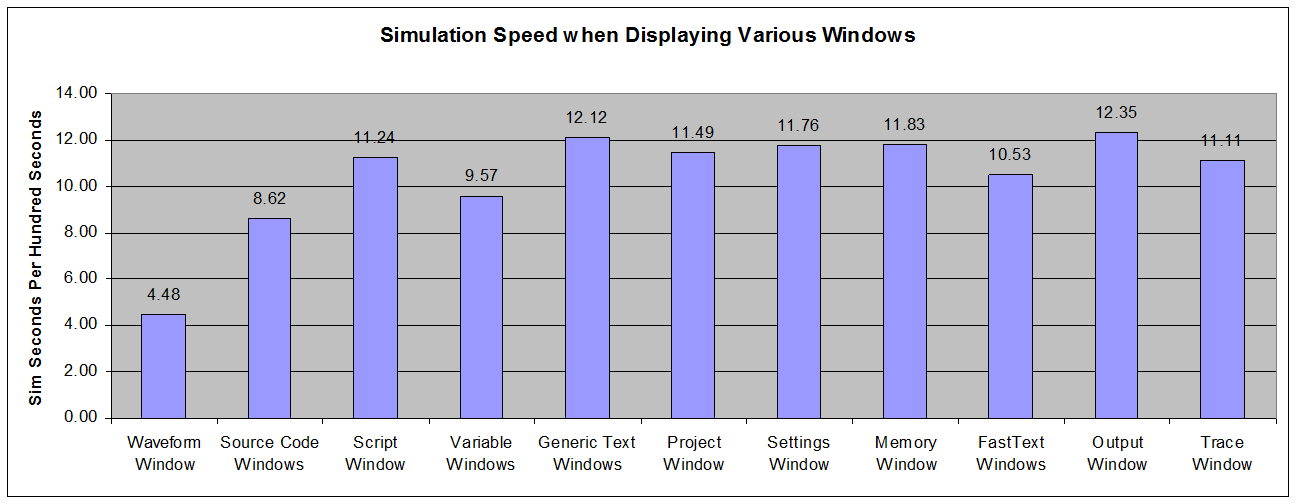
Most windows redraw fast enough such that having them visible does not have an appreciable affect on simulation speed. However, there are some exceptions. These exceptions depend very much on how they are being used. For instance, the waveform window displaying some vanilla waveforms such as I/O pins generally does not affect the simulation very much. However, if multiple variables are being displayed, it can affect simulation speed quite a bit. Here are some measurements in which only one window is visible in each measurement.
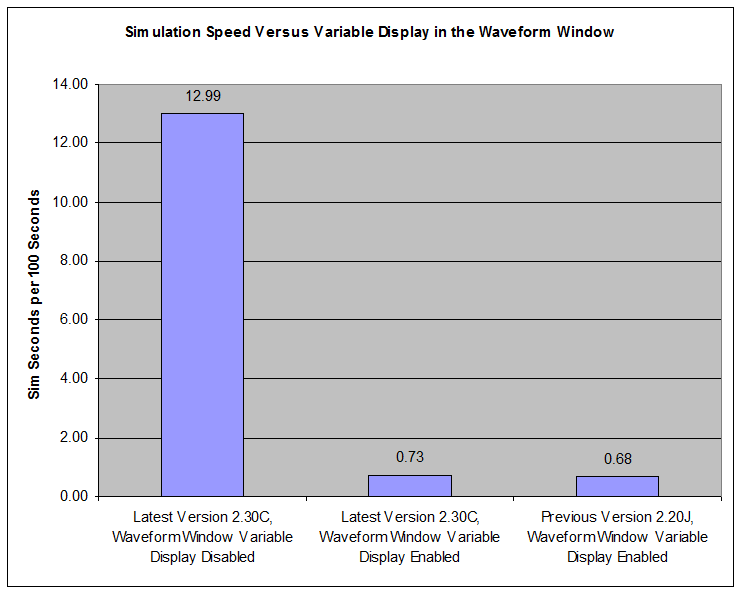
When the waveform window is displaying variables it can have a huge affect on simulation speed The following is an extreme case in which the values of several variables are being displayed in the waveform window. The first column indicates that the baseline simulation speed of 12.99 Sim Seconds Per Hundred Seconds. However, when several variables are being displayed in the waveform window this slows the simulation down to just 0.73 Sim Seconds per Hundred Seconds in the latest version 2.30C. This is somewhat faster that the simulation speed of 0.68 Sim Seconds per Hundred Seconds in previous version 2.20J. second.
It is important to note that the drag on simulation speed due to displaying variables is due to the storage of the variables, not their display. And the slowdown increases if the variable is more difficult to resolve. Therefore, a dereferenced pointer will be slower to display than (say) a global variable.
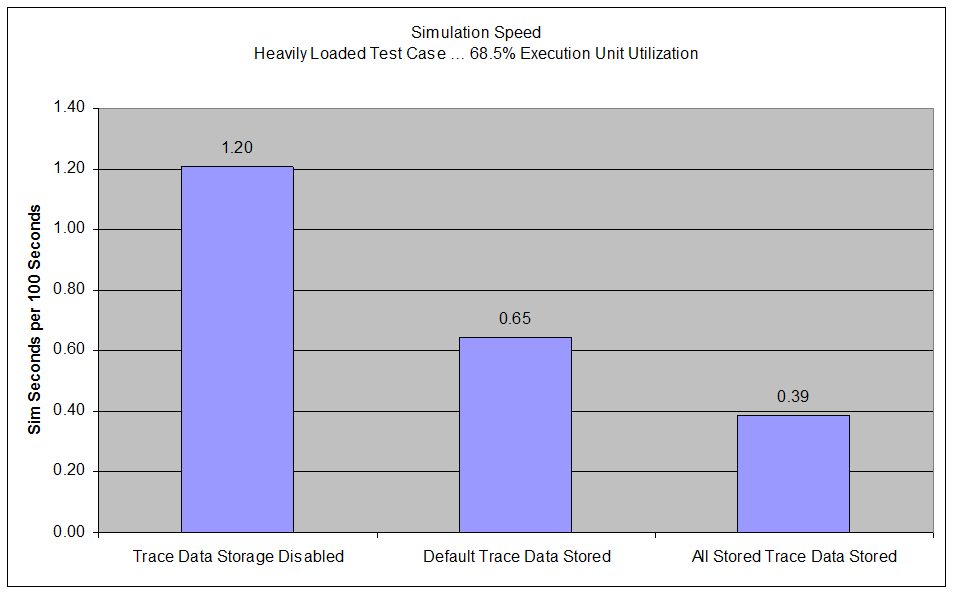
The primary drag on simulation speed is due to trace data is the storage not the display. It is therefore nearly useless to close the trace window. Instead, storage of the actual trace data can be either limited or entirely disabled to speed up a simulation. Four types of trace data (opcode fetch, TCR1 increment, TCR2 Increment, and instruction boundary) are disabled by default since they cause a particularly large drag on simulation speed.
It is important to note that the affects of storing trace data becomes increasingly large in cases where the execution unit utilization is high. Utilization rates vary from application to application and also vary based on the approach taken by the programmer. The case shown below (ARINC429 with maximum number of channels active) is PARTICULARLY EXTREME in that the execution unit is active 68.5% of the time. This is a particularly extreme case. In almost every other case the affects of disabling trace data storage will be far less.
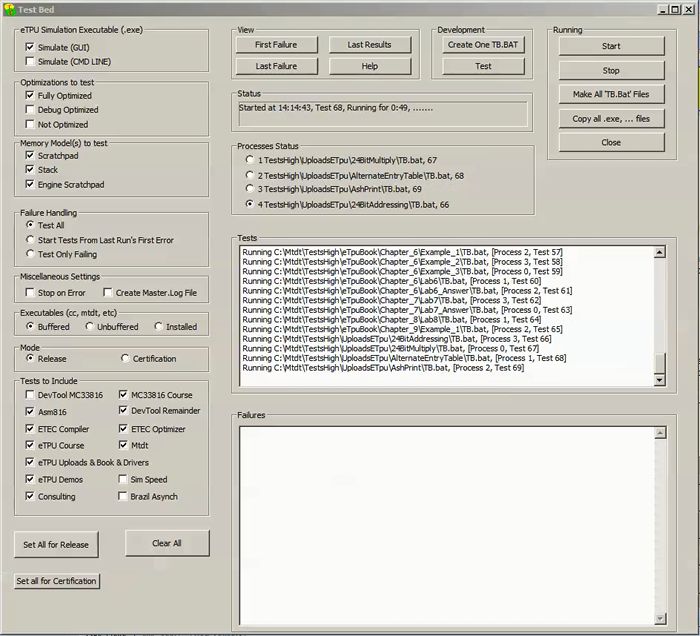
The DevTool Simulator has been carefully designed to run in a multi-processing environment. In fact, our simulation regression test harness concurrently runs four sets of tests (builds and simulations) thereby reducing testing time at the time of this writing from about 90 minutes to about 30 minutes (3X faster.)
It is critical to partition each set of tests into their own directories such that (say) the writing of report and log files do not collide. Note that files are generally place in the directory where the project file resides. So (for example) at any one time tests could be concurrently executing out of the following four directories
~\TestsHigh\ETpu\Angle\
~\TestsHigh\ETpu\AshPrint\
~\TestsHigh\ETpu\AtCodeTag\
~\TestsHigh\ETpu\BehaviorVerification\
Here is a snapshot of ASH WARE's testing harness that utilizes multi process testing to achieve a ~3X speedup in our regression test suite. Note that this test harness utilizes the I7's four cores with each core (process) running a test in it's own directory.
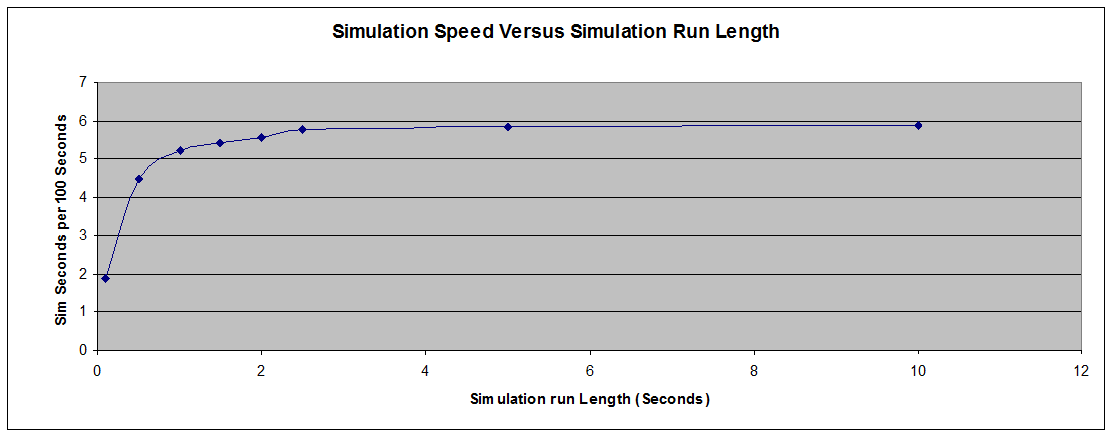
At one time it was thought that the simulation speed was slowing down for long simulation runs. However, when measuring the simulation speed it turns out that this does not appear to be the case. The author suspects that this (apparently) false impression was due to sluggish display updates rather than the simulator actually slowing.
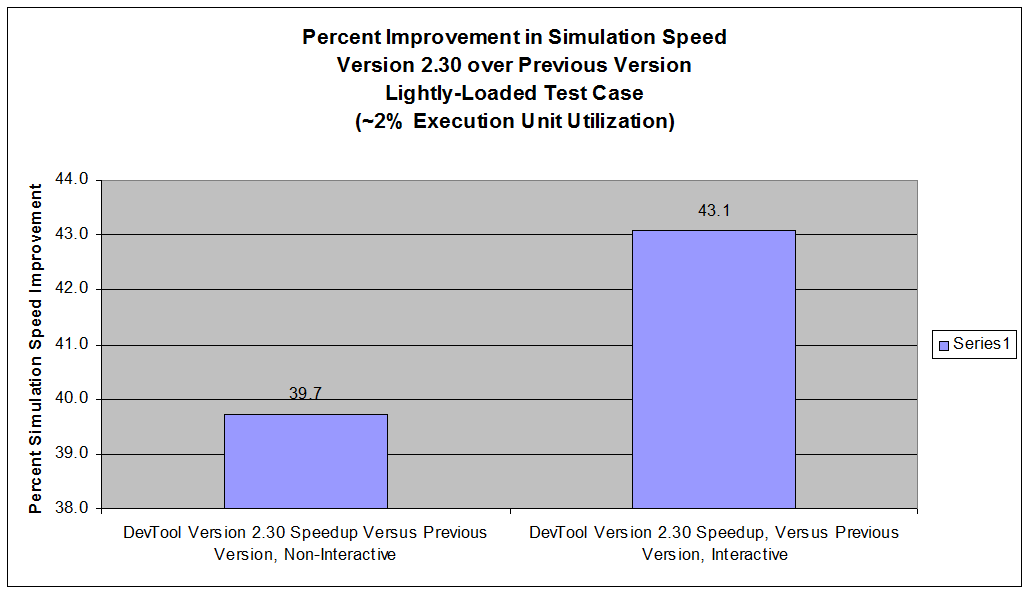
One way of improving your simulation speed to to upgrade to the latest version. DevTool Version 2.30 is significantly faster than previous versions as shown below.
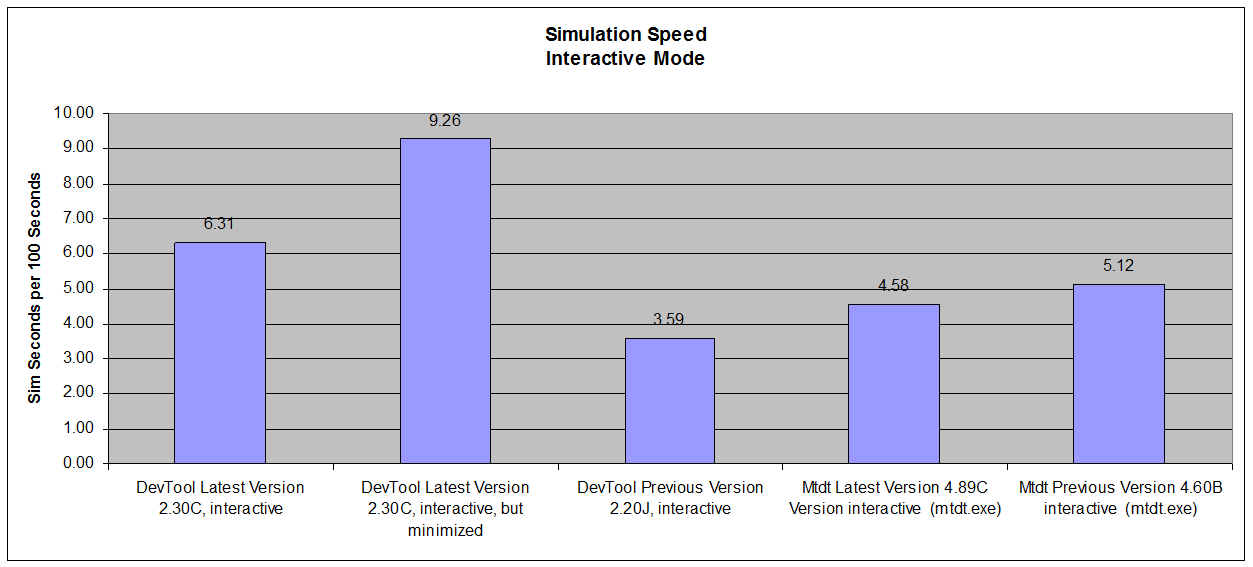
In interactive mode DevTool is visible in the display and the GUI is active such that windows are visible and breakpoints, single stepping, etc., are all available. Interestingly, the second data shows that by just minimizing the display the simulation speed improves significantly suggesting (say) that if you have a simulation running and you step away from your desk you might minimize the simulation such that it will have progressed further when you return. Simulation speed in interactive mode is considered to be the most important performance index because this is how the simulator is generally used the most often.
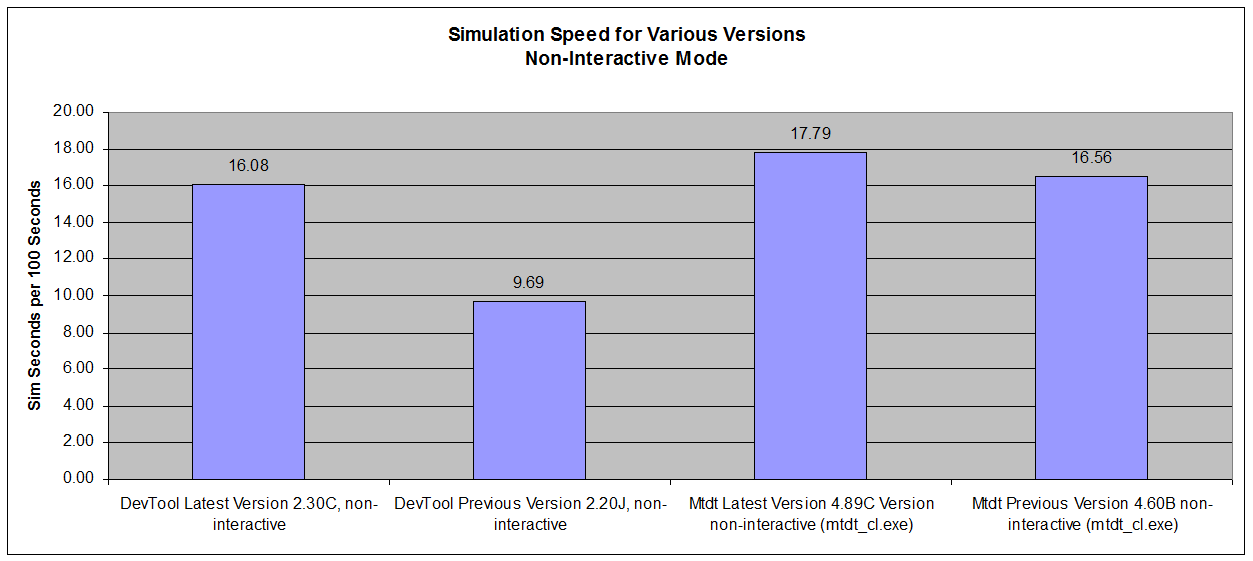
In non-interactive mode the simulator is hidden from view and all windows are closed and trace data is not stored to the buffer. As such it is generally part of an automated test suite that runs when the user is away from their computer. As such it is considered a somewhat less important (but still important) performance index.
Note that the information provided in this section is for a lightly-loaded test case in which the execution unit utilization is about 2%.
All tests are run at 100 MHz on I7 laptop computer. Simulation speed is ratiometric with clock speed such that if your eTPU is running at 132 MHz if the simulator is shown as running 16 Sim Seconds per Hundred Seconds then this will become 16/1.32 or 12.3 Sim Seconds per Hundred Seconds.
The high utilization tests run an ARINC429 driver test with an execution unit utilization of 68.5%. The low utilization test run the 'Freescale Engine Demo' which is available on the ASH WARE website. It runs at about 2% execute unit utilization as tested.
Simulation speed terms are the number of second that can be simulated in 100 seconds. For example, if the number is '16' then in 100 seconds, 16 eTPU seconds is simulated.
The affects on simulation speed in interactive mode depends greatly on the mix of windows that are open. The open window chosen for this test is the windows as they appear in our off-the-shelf demos.
The 'Previous' release of DevTool used here is Version 2.20 Build J which was releases at the start of 2016-Q2 and the 'Latest' version of DevTool is 2.3 Build C due for release in 2016 Q4. The previous version of Mtdt is 4.60 Build B which was released in 2011 and the latest version is 4.89 Build C due for release in 2016-Q4.
In all cases performance correlates directly with the power of your computer. As they say, 'if you want a faster mouse trap, throw it off a higher bridge."